Token Usage Dashboard
Admins can use the Token Usage Dashboard to proactively monitor monthly AI token consumption against their token budget. From the AI Reporting tab, admins can track daily usage metrics, view monthly consumption projections, and inspect agent-level usage. This visibility allows organizations to monitor token usage over time, understand whether they are likely to remain within token budgets or exceed them, and plan accordingly.
Who can use this feature?
- Business Admin Users — Browser
- Viewing the Token Usage Dashboard
- A Veeva AI license is required
Configuring the Token Usage Dashboard for
 Business Admin Users
To configure this feature:
- Ensure Configuring Vault AI in CRM is complete.
- Navigate to Admin > Users & Groups > Permission Sets.
- Select the appropriate permission set.
- Select the Objects tab.
- Grant the following permissions:
Object
Object Permission
Object Types
Fields
Field Permission
ai_settings__v
R
All applicable object types
- application_profile__v
- monthly_token_budget__v
Read
daily_agent_activity__sys R All applicable object types - aggregation_date__sys
- total_tokens__sys
- agent_id__sys
- agent_label__sys
- status__sys
Read daily_agent_action_activity__sys R All applicable object types - aggregation_date__sys
- agent_id__sys
- agent_label__sys
- successful_action_executions__sys
- failed_action_execution__sys
- total_tokens__sys
- status__sys
Read - Select the Tabs tab.
- Grant View access to the ai_reporting__v tab.
- Navigate to Admin > Configuration > Tabs.
- Ensure the ai_reporting__v tab has a status of Active.
- Navigate to Business Admin > Objects > AI Settings > Global AI Settings.
- Populate the monthly_token_budget__v field with the number of tokens budgeted for each month.
Changes to monthly_token_budget__v field values only apply for the current month and future months. Calculations for past months remain accurate to the token budget in effect at that time.
Viewing the Token Usage Dashboard as
Business Admin Users
Business Admin Users can view monthly AI token usage and review execution metrics across all AI agents configured in the Vault.
The visualizations on the Token Usage Dashboard display only if admins have populated the monthly_token_budget__v AI Setting with a monthly token budget.
To access the dashboard, navigate to the AI Reporting tab.
Users can filter token metrics by time period by selecting the desired month from the month selector. Vault displays usage metrics and token projections for the selected month. Dashboard data is updated daily.
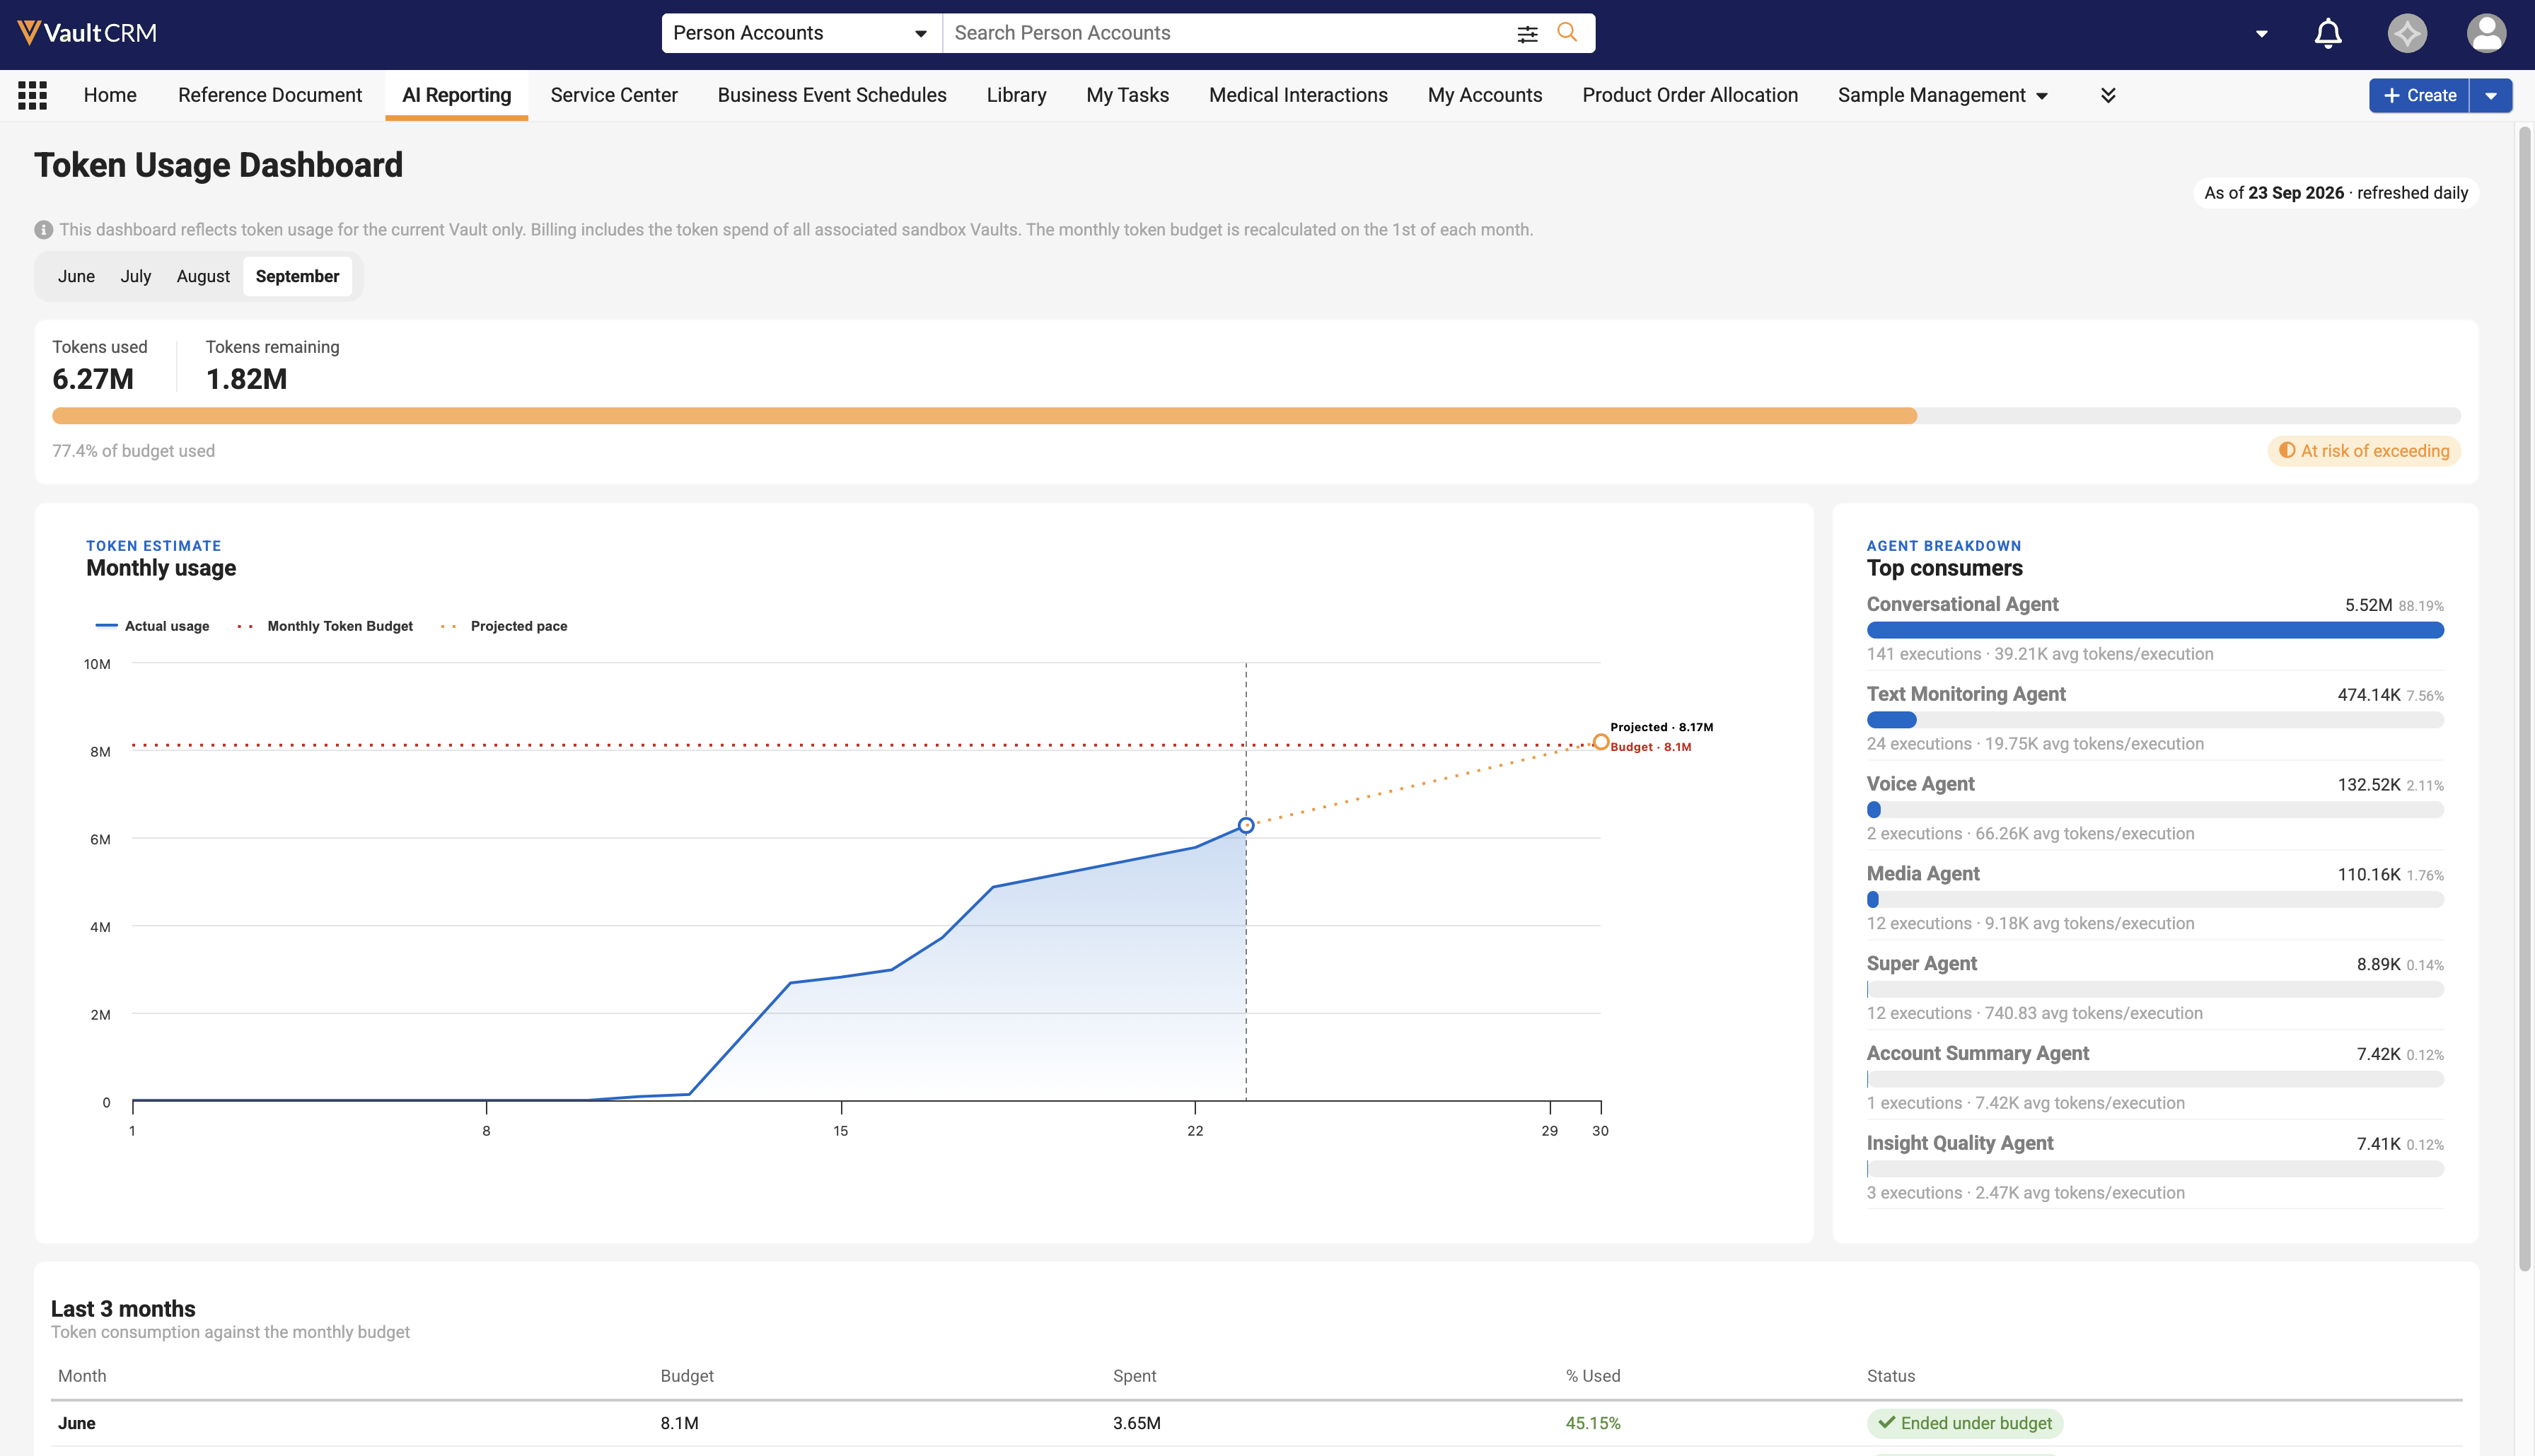
The following visualizations are available on the dashboard to help admins monitor usage:
- Tokens Used Chart - Displays a bar chart indicating tokens used and tokens remaining. At a glance, admins can understand whether the Vault’s usage for the month is trending within the token budget, whether it is at risk of exceeding the budget, or whether it has exceeded the budget.

If a past month is selected, admins can see whether the month ended within or above the token budget.
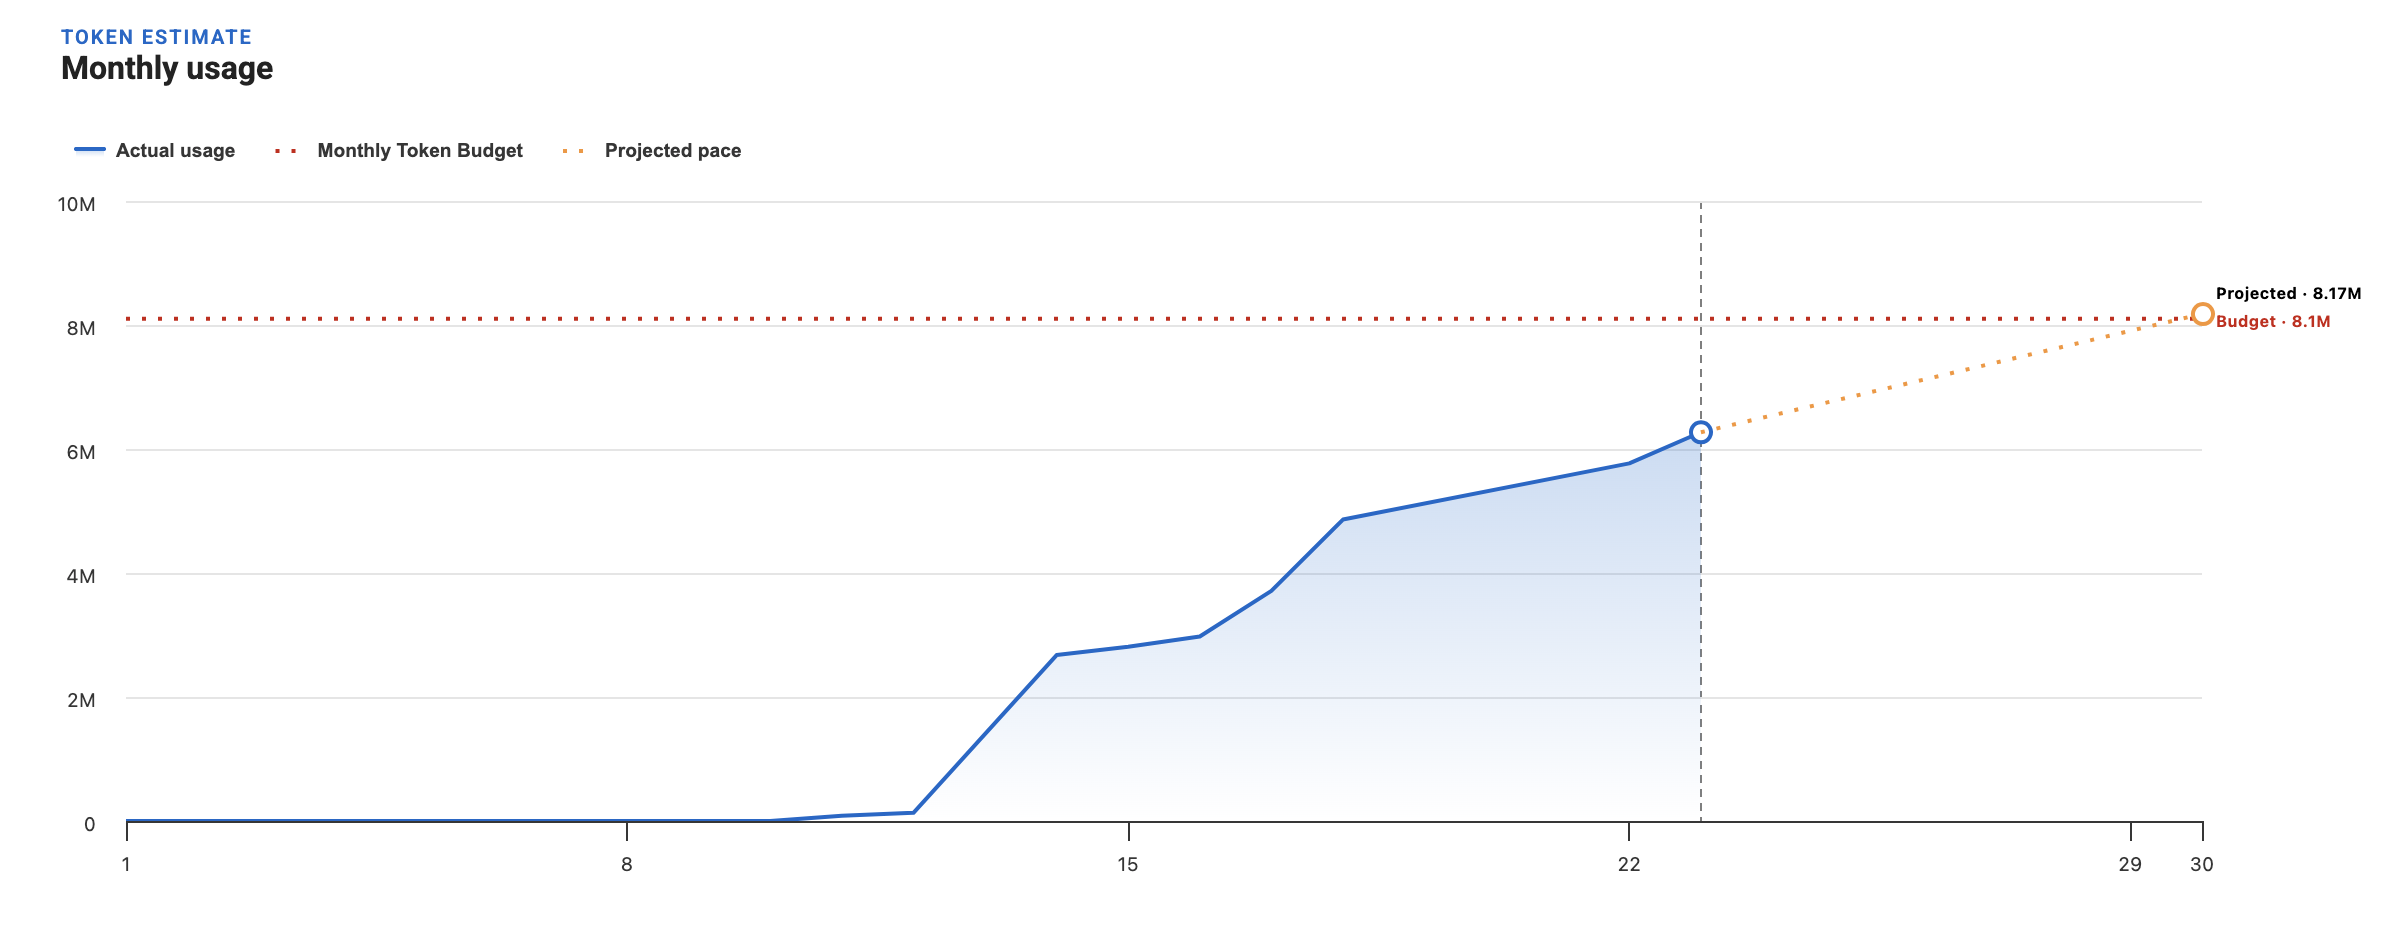
- Daily Token Usage Graph - Displays accumulated daily tokens alongside the budget line and projected end-of-month token usage. This information helps admins analyze daily token trends and monthly projections.
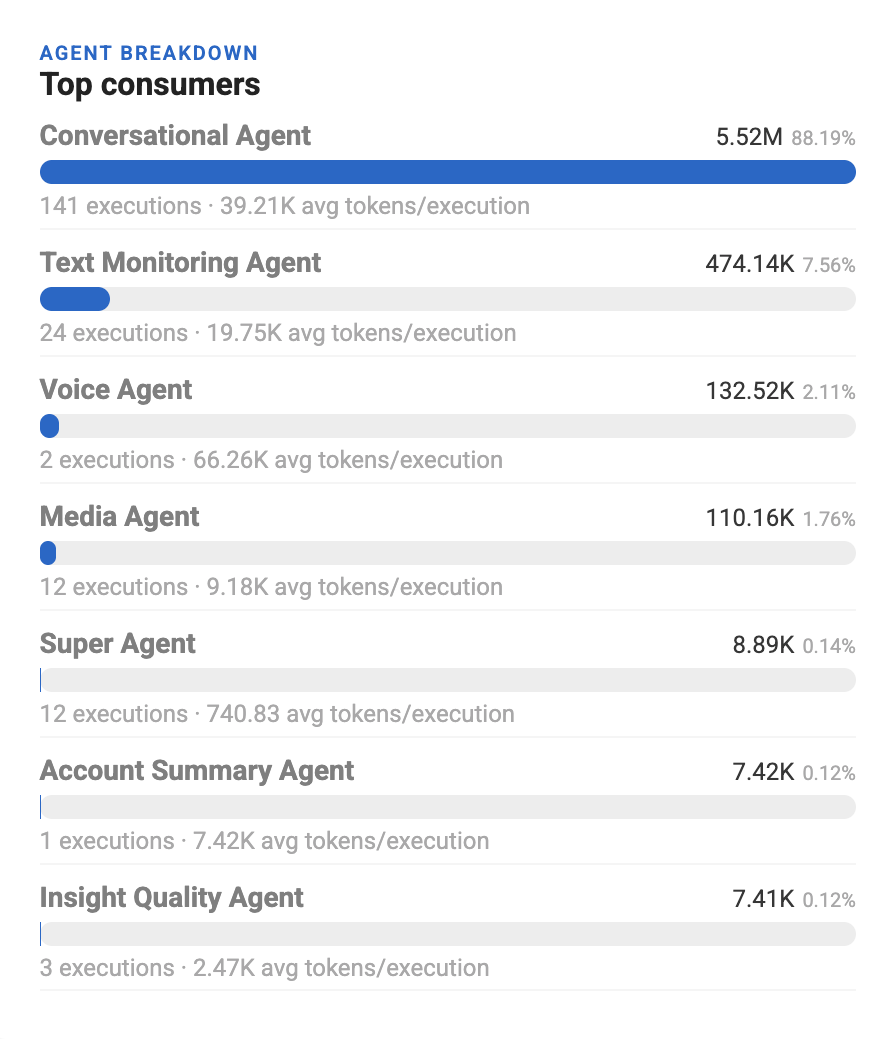
- Agent Breakdown Table - Displays total consumed tokens, action execution counts, average tokens per execution, and usage percentages for each AI agent. This information helps admins analyze token usage per agent. The table is sorted by total tokens in descending order.
- Last 3 Months Table - Lists monthly token budgets, total spent tokens, and usage percentages for the current month and previous three months. This enables admins to easily analyze usage trends over time.