Using the Compass Prescriber Data Page Template
A Veeva Compass account is required to use this feature.
By leveraging the Compass Prescriber Data Template within MyInsights Studio, content creators can gain a data-driven edge in understanding market dynamics and identifying key HCPs for engagement.
The embedded data provides insights into projected prescriptions and procedures for both retail and non-retail products, all at the HCP level. This granular view equips users to:
- Uncover Market Trends - Analyze prescribing patterns and identify emerging trends within the market
- Target High-Potential HCPs - Pinpoint HCPs with a high volume of projected prescriptions or procedures for your products, allowing for targeted outreach and marketing efforts
Who can use this feature?
- Content Developers - Browser
- Configuring the Prescriber Data Page Template for
- End Users - Browser, iPad, iPhone
- Using the Prescriber Data Page Template as
- Users require a Veeva Compass account
Configuring the Prescriber Data Page Template for
To configure this feature:
- Ensure Configuring X-Pages is complete.
- Ensure Configuring X-Pages Studio is complete and the user has deployment permissions.
- Ensure Viewing Compass Data Using MyInsights is configured.
-
Navigate to Business Admin > Objects > analytics_product_group__v.
- Create or load your Analytic Product Groups, based on the cohort definitions, to define your market and the associated diagnosis code you plan to visualize in the data. To load your Analytic Product Groups instead, see Vault Loader: Create, Update & Delete Object Records.
- Enter the diagnosis code and diagnosis description for the Analytics Product Group in the Product Group field
- Enter the Analytics Market for the Analytic Product Group in the Market field
- Repeat as needed for each Analytics Product Group
- Download the Prescriber Data page template.
- Log into MyInsights Studio to import and deploy the template to users.
Remove decimals from diagnosis codes. For example, C18.0 should be entered as C180.
Using the Prescriber Data Page Template as
Mobile devices require an internet connection to display data.
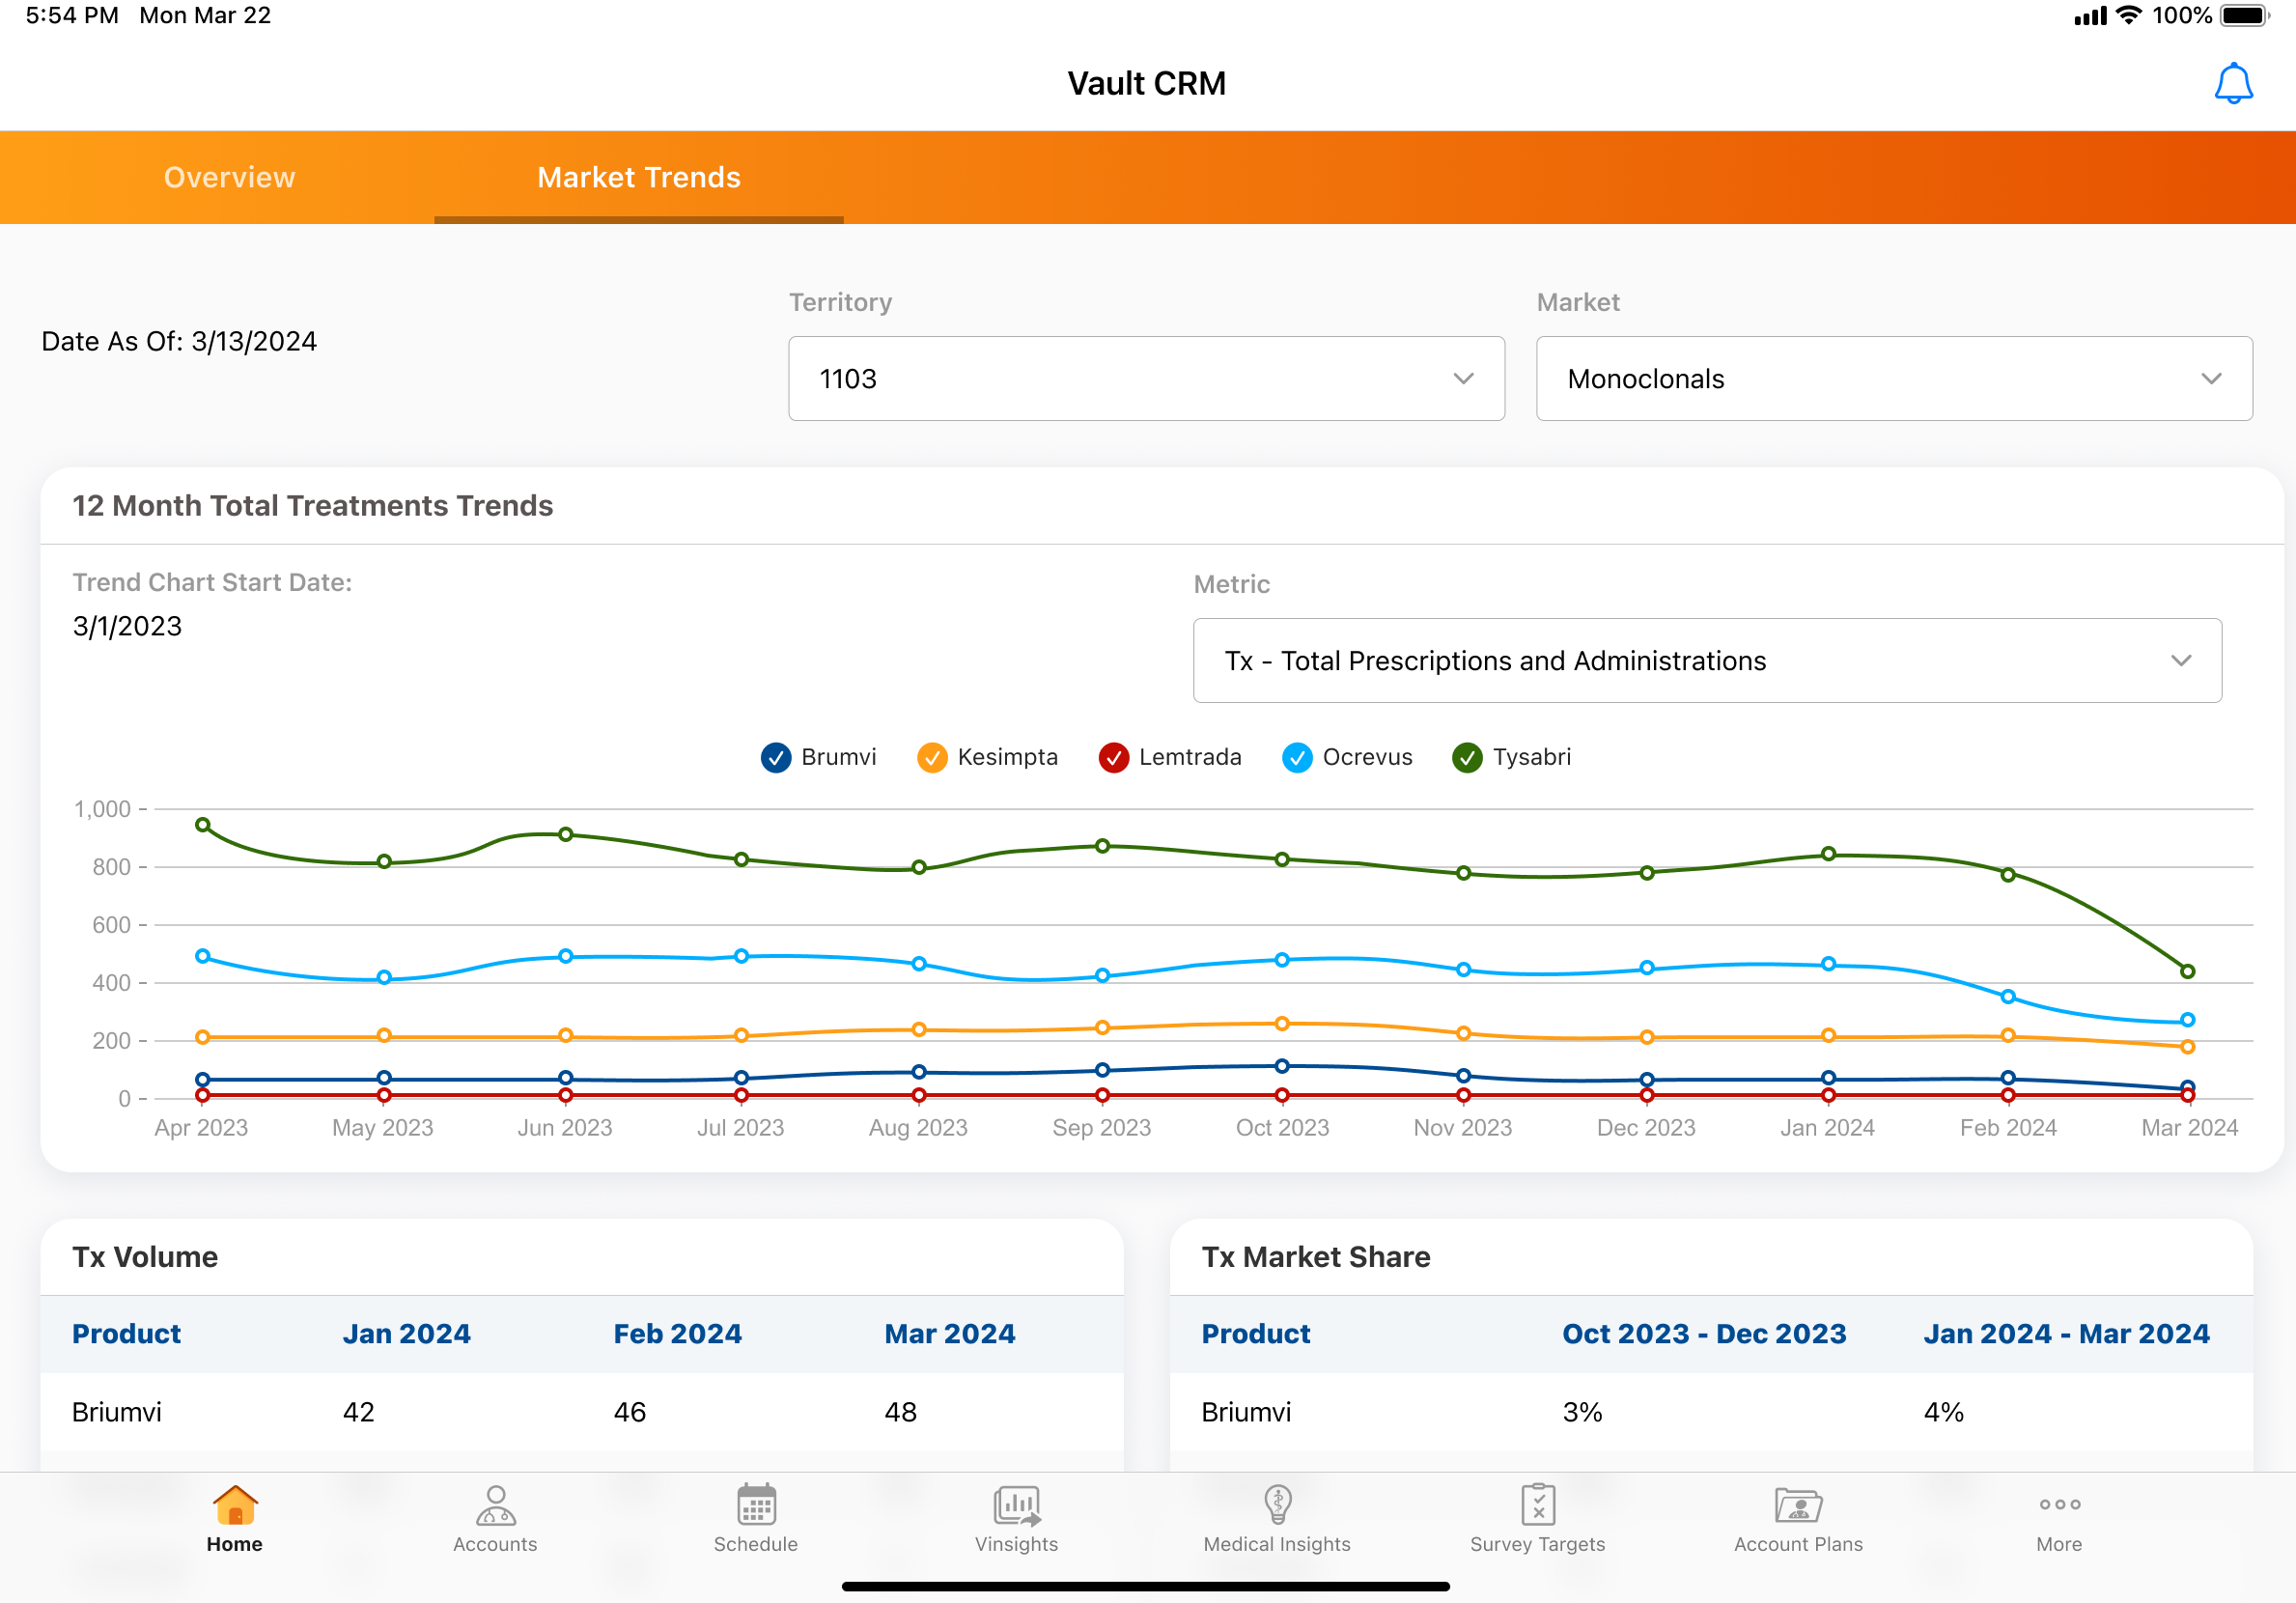
The Prescriber Data page template displays the following sections:
- 12 Month Tx Trends - Displays trends from the last 12 months of data for the selected market and metric
- Tx Volume by Product - Displays the total prescription volume for the most recent three months of data
- Tx Product Market Share - Displays the market share information for the most recent six months of data
- Top HCPs with Tx - Displays the top or bottom HCPs sorted by the volume of the selected product and metric and in the selected time period
- HCPs with Tx Volume Change - Displays the top or bottom HCPs sorted by the volume change of the selected product and metric and in the selected time period