Monitoring Patient Journey Statistics
End users can use the Patient Center Overview tab to quickly view statistics about a specific Patient Journey, including monitoring patient volumes, adherence, and unresolved escalations.
Who can use this feature?
- End Users – Browser
- Reviewing Patient Journey Statistics
- Users require a Patient CRM License
Configuring Monitoring Patient Journey Statistics for
To configure this feature:
- Ensure Configuring Patient CRM is complete.
- Navigate to Admin > Users & Groups > Permission Sets.
- Select the appropriate permission set.
- Select the Objects tab.
-
Grant the following permissions:
Object
Object Permission
Object Types
Fields
Field Permission
adherence__v
R
All
enrolled_in_adherence__v
Read
patient_journey_step_phase__v
CRE
All
enter_therapeutic_phase__v
Edit
patient_journey_step_phase_detail__v
R
All
step_phase_completion_date__v
Read
- Navigate to the Tabs tab.
- Grant access to the Patient Center Overview tab.
- Navigate to Admin > Configuration > Objects > patient_journey_step_phase__v > Layouts.
- Place the enter_therapeutic_phase__v field on the appropriate layouts.
- Navigate to the patient_journey_step_phase__v record representing the start of therapy.
- Select Yes for the enter_therapeutic_phase__v field.
Reviewing Patient Journey Statistics as
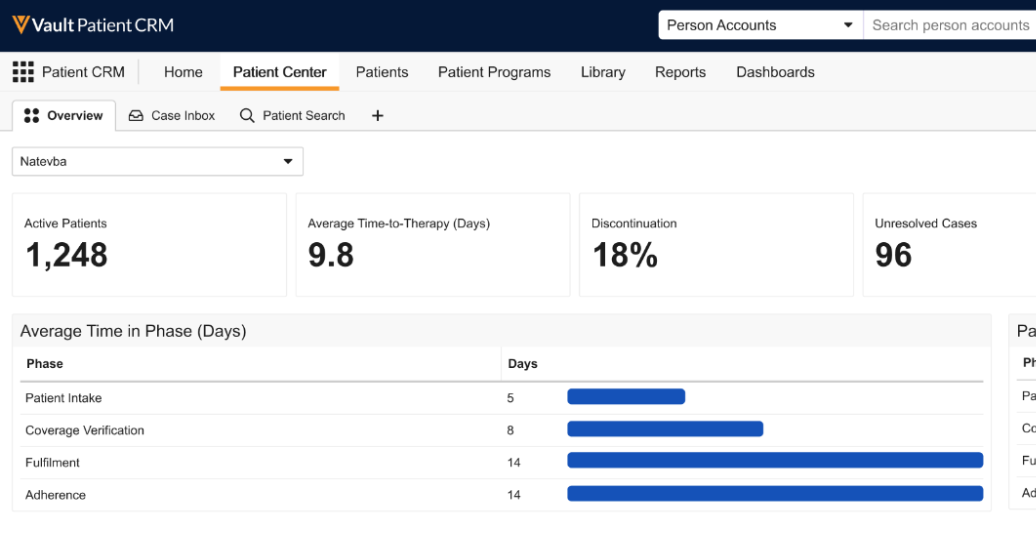
Patient Services Users can view key metrics and visualizations for patient journeys on the Patient Center Overview tab.
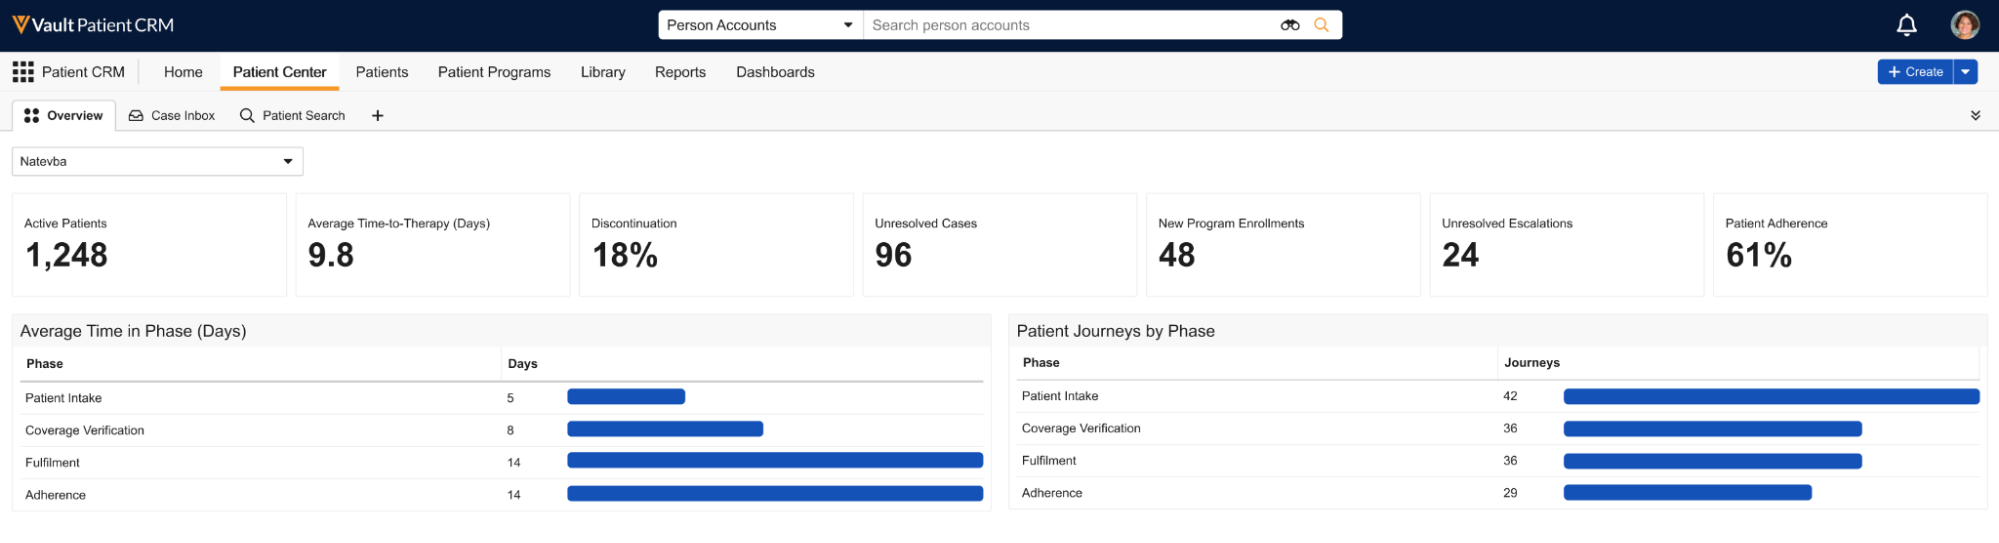
The following statistics display:
- Active Patients – The number of patients currently enrolled in the Patient Journey
- Average Time-to-Therapy (Days) – The average time, in days, patients spend enrolled in the Patient Journey before the therapy begins
- Discontinuation – The percentage of patients discontinued from the Patient Journey
- New Program Enrollments – The total number of patients who enrolled in the journey within the last seven days
- Unresolved Escalations – The total count of cases with a status of Escalated.
- Patient Adherence – The percentage of enrolled patients who are considered adherent within the Patient Journey
- Average Time in Phase (Days) – This bar chart displays the average time patients spend in each phase of the selected Patient Journey
- Patient Journeys by Phase – This bar chart displays the number of patients currently in each phase of the journey
If multiple Patient Journeys are enabled, end users can use the picklist at the top of the tab to view the appropriate Patient Journey.