Using the Diagnosed Patient Page Template
A Veeva Compass account is required to use this feature.
The Diagnosed Patient page template displays metrics and detailed diagnosis data, including prescribed products, within the selected territory for patients diagnosed with a specific disease or treatment option.
The Diagnosed Patient page template is available for content creators to start with, and helps end users answer some of the most common sales questions:
- How many patients were diagnosed in the last 30 days in my territory?
- Do I have a new patient in my territory?
- Which HCP diagnosed the patients?
- Who is the referring HCP?
Who can use this feature?
- Content Developers - Browser
- Configuring the Diagnosed Patient Page Template for
- End Users - Browser, iPad, iPhone
- Using the Diagnosed Patient Page Template as
- Users require a Veeva Compass account
Configuring the Diagnosed Patient Page Template for
To configure this feature:
- Ensure Configuring X-Pages is complete.
- Ensure Configuring X-Pages Studio is complete and the user has deployment permissions.
- Ensure Viewing Compass Data Using X-Pages is configured.
-
Navigate to Business Admin > Objects > analytics_product_group__v.
-
Create Analytic Product Groups, based on the cohort definitions, to define your market and the associated diagnosis code you plan to visualize in the data. To load your Analytic Product Groups instead, see Vault Loader: Create, Update & Delete Object Records.
- Enter the diagnosis code and diagnosis description for the Analytics Product Group in the Product Group field
- Enter the Analytics Market for the Analytic Product Group in the Market field
- Repeat as needed for each Analytics Product Group
Remove decimals from diagnosis codes. For example, C18.0 should be entered as C180.
- Download the Diagnosed Patient page template.
- Log into X-Pages Studio to import and deploy the template to users.
Using the Diagnosed Patient Page Template as
Mobile devices require an internet connection to display data.
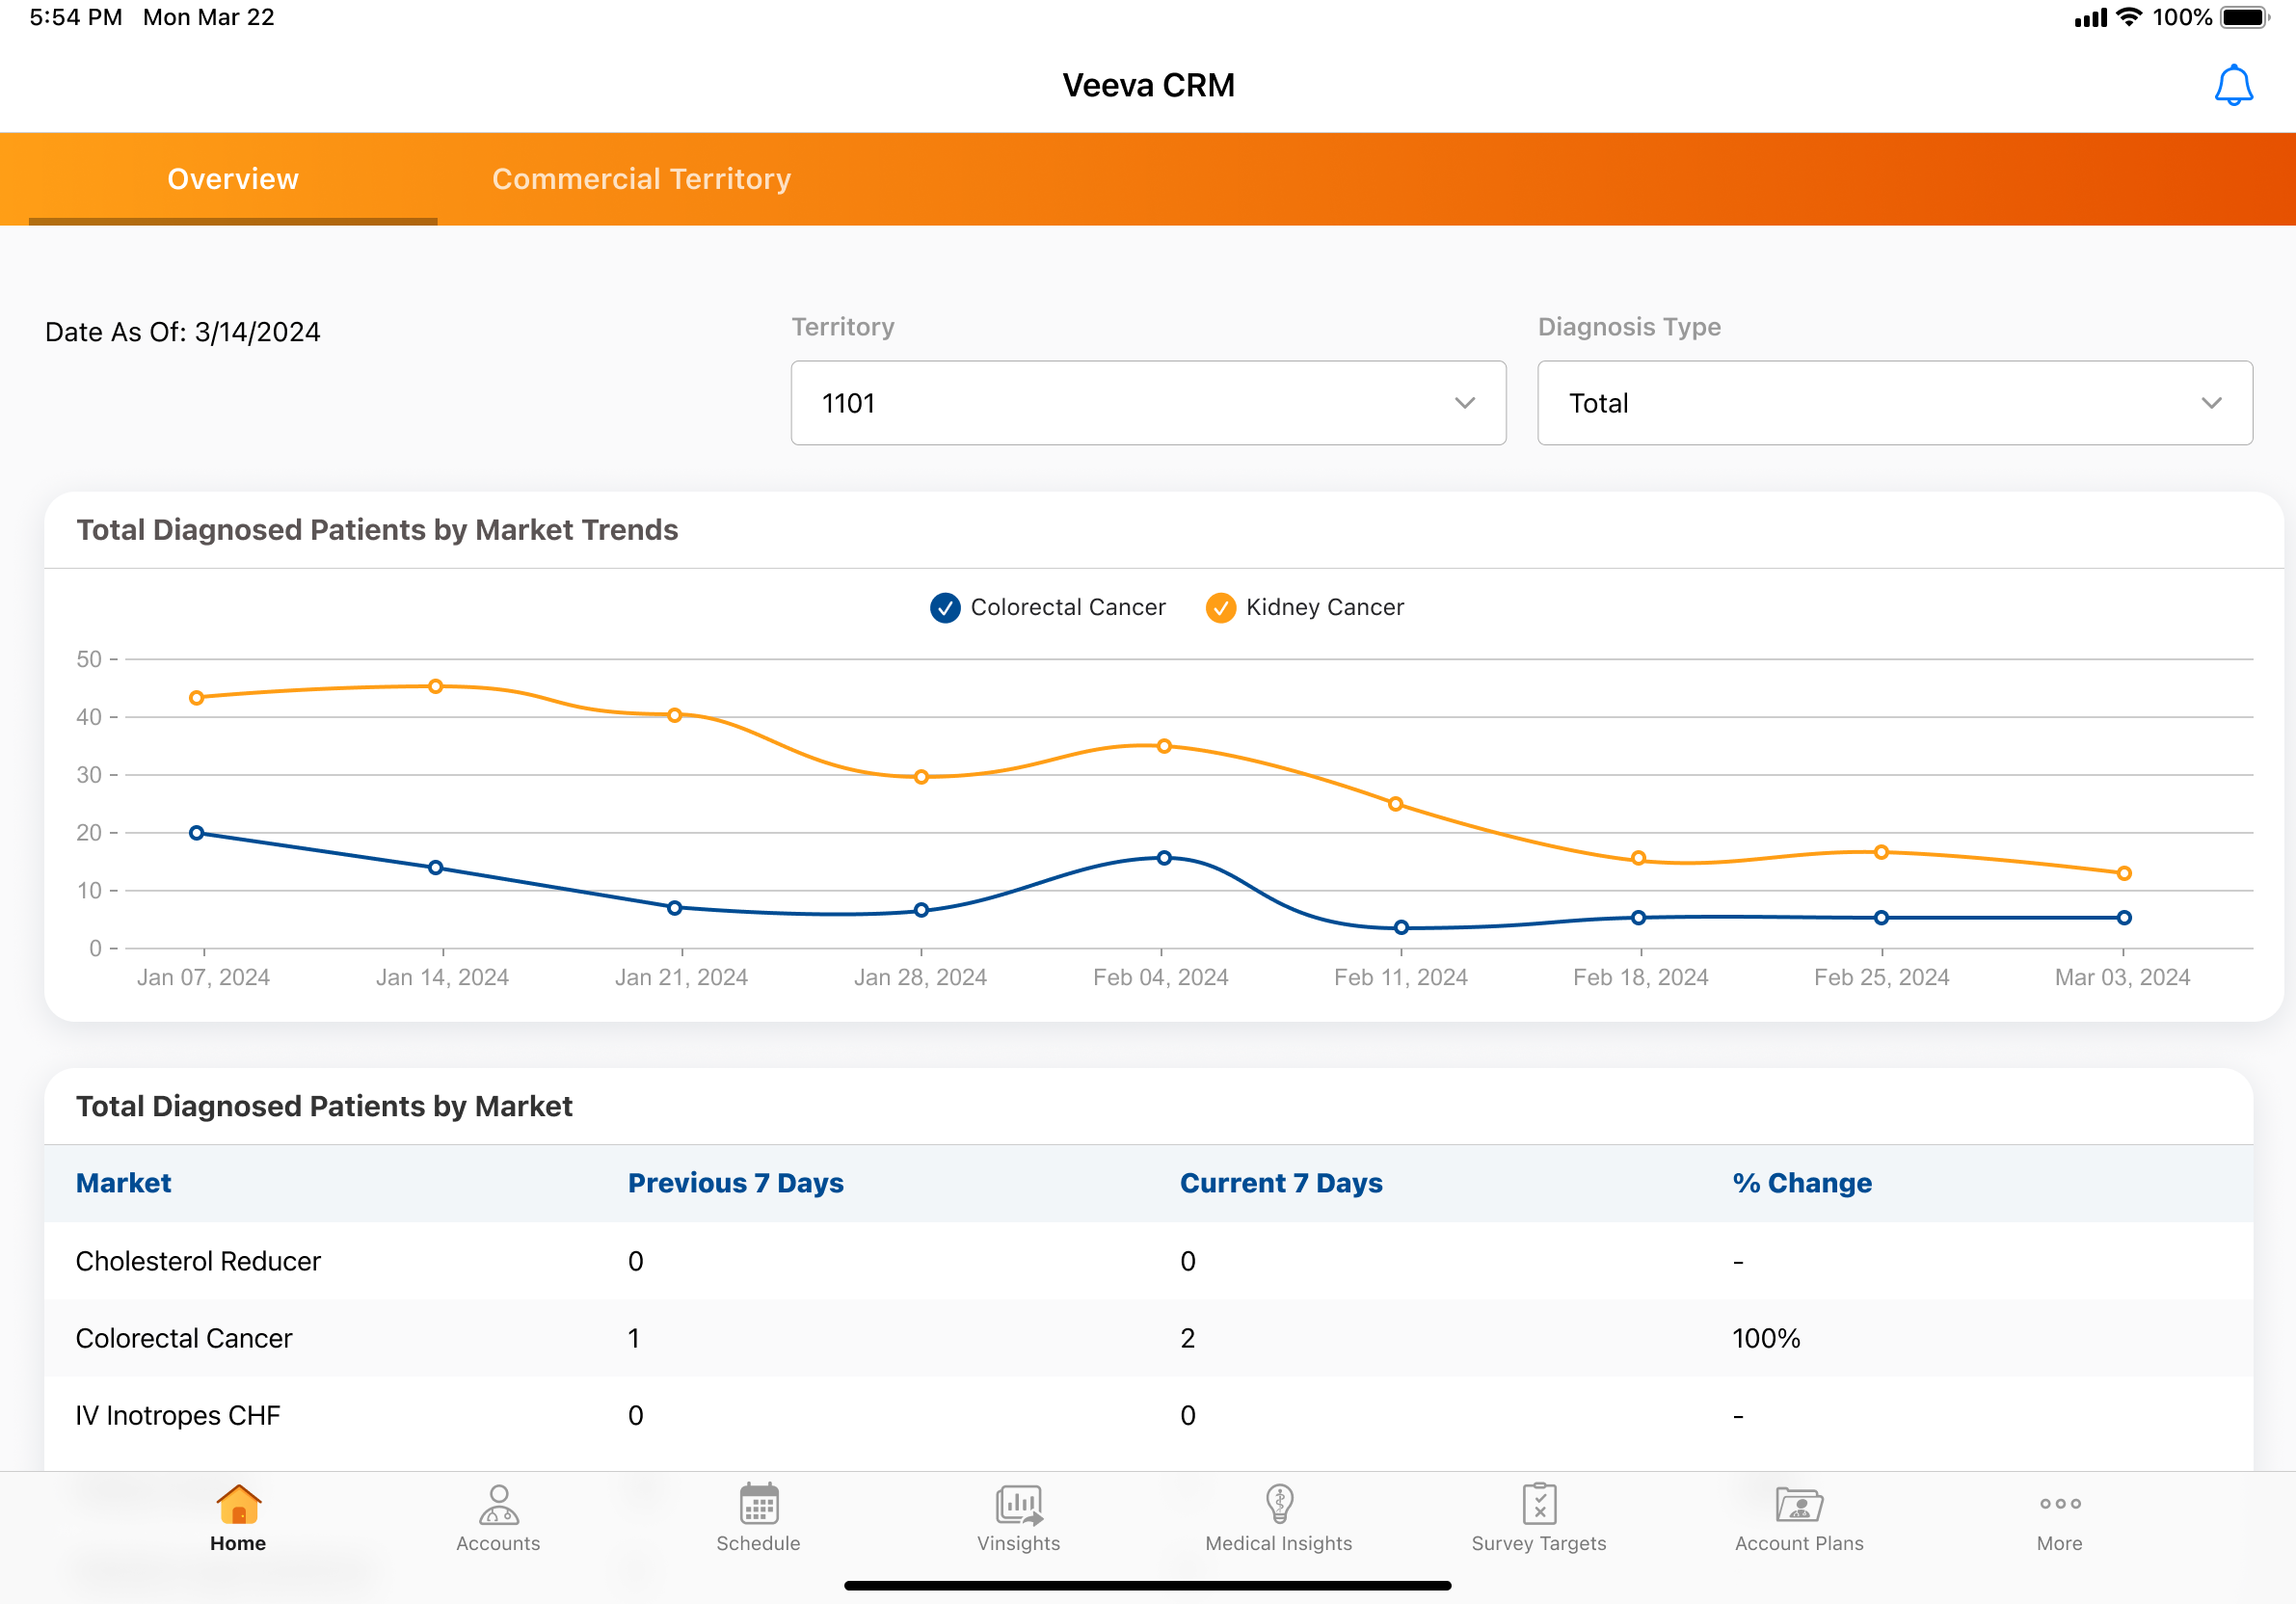
Select a Territory and one of the following Diagnosis Types:
- Total - Counted from Compass patient data
- New - Counted from Compass patient data if a patient is diagnosed with a diagnosis market for the first time or after a one year period
- Referred In - Counted from Compass patient data if a patient is referred in by a HCP
Depending on the Diagnosis Type selected, the Diagnosed Patient page template displays information in the following sections:
Content creators can extend the date range in the template to display up to 90 days of data.
- Diagnosed Patients by Market - Displays trends from the last 9 weeks of data (from Sunday 9 weeks ago to the end of the current week) for the different markets
- Market Diagnosed Patient Change - Depending on the Territory and Diagnosis Type selected, displays the change in the different markets for the past 14 days by amount and percentage
- HCPs w/ Most Diagnosed Patients - Displays the 10 HCPs with the highest diagnoses count for the selected market and time period and the change by percentage
- HCPs w/ Latest Diagnosis - Displays the 10 HCPs with the most recent diagnosis for the selected market